|
|
Sponsored Content
Top Forums
UNIX for Advanced & Expert Users
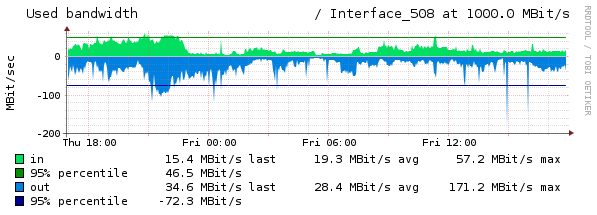
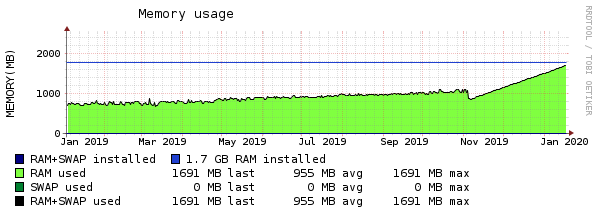
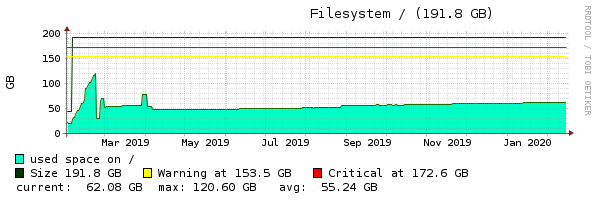
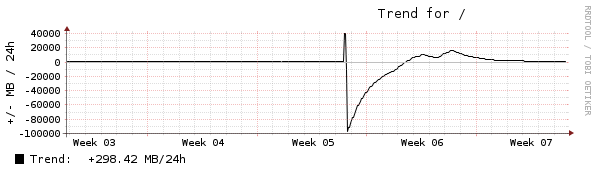
Nearly Random, Uncorrelated Server Load Average Spikes
Post 303044127 by stomp on Friday 14th of February 2020 12:23:07 PM

|
|
10 More Discussions You Might Find Interesting
1. UNIX for Advanced & Expert Users
we have an unix system which has
load average normally about 20.
but while i am running a particular unix batch which performs heavy
operations on filesystem and database average load
reduces to 15.
how can we explain this situation?
while running that batch idle cpu time is about %60-65... (0 Replies)
Discussion started by: gfhgfnhhn
0 Replies
2. UNIX for Dummies Questions & Answers
Hello all, I have a question about load averages.
I've read the man pages for the uptime and w command for two or three different flavors of Unix (Red Hat, Tru64, Solaris). All of them agree that in the output of the 2 aforementioned commands, you are given the load average for the box, but... (3 Replies)
Discussion started by: Heathe_Kyle
3 Replies
3. UNIX for Dummies Questions & Answers
Hello, Here is the output of top command. My understanding here is,
the load average 0.03 in last 1 min, 0.02 is in last 5 min, 0.00 is in last 15 min.
By seeing this load average, When can we say that, the system load averge is too high?
When can we say that, load average is medium/low??... (8 Replies)
Discussion started by: govindts
8 Replies
4. Solaris
Hi,
i have installed solaris 10 on t-5120 sparc enterprise.
I am little surprised to see load average of 2 or around on this OS.
when checked with ps command following process is using highest CPU. looks like it is running for long time and does not want to stop, but I do not know... (5 Replies)
Discussion started by: upengan78
5 Replies
5. UNIX for Dummies Questions & Answers
Hello AlL,..
I want from experts to help me as my load average is increased and i dont know where is the problem !!
this is my top result :
root@a4s # top
top - 11:30:38 up 40 min, 1 user, load average: 3.06, 2.49, 4.66
Mem: 8168788k total, 2889596k used, 5279192k free, 47792k... (3 Replies)
Discussion started by: black-code
3 Replies
6. UNIX for Advanced & Expert Users
Hi ,
I am using 48 CPU sunOS server at my work.
The application has facility to check the current load average before starting a new process to control the load.
Right now it is configured as 48. So it does mean that each CPU can take maximum one proces and no processe is waiting.
... (2 Replies)
Discussion started by: kumaran_5555
2 Replies
7. Solaris
NPROC USERNAME SWAP RSS MEMORY TIME CPU
320 oracle 23G 22G 69% 582:55:11 85%
47 root 148M 101M 0.3% 99:29:40 0.3%
53 rafmsdb 38M 60M 0.2% 0:46:17 0.1%
1 smmsp 1296K 5440K 0.0% 0:00:08 0.0%
7 daemon ... (2 Replies)
Discussion started by: snjksh
2 Replies
8. UNIX for Dummies Questions & Answers
Hi,
I am getting a high load average, around 7, once an hour. It last for about 4 minutes and makes things fairly unusable for this time.
How do I find out what is using this. Looking at top the only thing running at the time is md5sum.
I have looked at the crontab and there is nothing... (10 Replies)
Discussion started by: sm9ai
10 Replies
9. UNIX for Dummies Questions & Answers
how load average is calculated and what exactly is it
difference between cpu% and load average (9 Replies)
Discussion started by: robo
9 Replies
10. Programming
Here we go....
Preface:
..... so in a galaxy far, far, far away from commercial, data sharing corporations.....
For this project, I used the ESP-WROOM-32 as an MQTT (publish / subscribe) client which receives Linux server "load averages" as messages published as MQTT pub/sub messages.... (6 Replies)
Discussion started by: Neo
6 Replies
LEARN ABOUT DEBIAN
gpiv_process-chain
GPIV_PROCESS-CHAIN(1)					      General Commands Manual					     GPIV_PROCESS-CHAIN(1)

NAME

       gpiv_process-chain - Processes a pipe of Gpiv-tool command's.

SYNOPSIS

       gpiv_process-chain  [-af  string]  [-h  |  -help] [-n | -none] [-c | -clean] [-fik] [-p | -print] [-pf -string] [-proc_*] [-t format] [-v |
       -version] filename

DESCRIPTION

       Gpiv_process-chain processes a pipe of gpiv commands. Image evaluation/interrogation with gpiv_rr is always included, image  recording  may
       be  prepended  before  interrogation,  validation  and post-processes may be appended to the chain. The filename represents the name of the
       image to be evaluated. The file naming conventions are idententic to the output of the individual Gpivtools programs: in  case  the  output
       are  (validated/scaled)	PIV data, the data will be directed to filename.piv, with -proc_vorty the output will be called filename.vor, with
       -proc_nstrain the output will be called filename.nstr and, finally, with with -proc_sstrain the output will be called filename.sstr.

       This program does not use the parameter resources from libgpiv.

Options
       -af string Append string to file-base name.

       -h | --help
	      On-line help.

       -n | --none
	      Suppresses real execution.

       -c | -clean
	      Cleans up: removes raw image data and header.

       -fik   Use fi-keyline for filtering gpiv parms from README.

       -p | --print
	      Prints parameters, command line options and input and output filenames to stdout.

       -pf string
	      Prepend string to file-base name.

       -proc_*
	      Defines processes to be included in the chain. * is substituted by: imgrec, valid, scale,  manipiv,  flipx,  flipy,  revert,  rot90,
	      rot180 and vorty or nstrain or sstrain. Vorty, nstrain and sstrain may not be used in combination with -t gpi.

       -t format
	      Image type or format: hdf (.hdf), dav (.IMG) or a type as defined by ImageMagic's convert. Default is raw binary image (.r).

       -v | --version
	      Prints version information to standard output, then exits successfully.

       filename
	      Input image filename. Format may be: .r, .hdf (hdf), .IMG (davis), .png, .gif, .tif or.bmp.

EXAMPLES

       invoking: 'gpiv_process-chain -proc_valid -proc_scale testfile.png' will actually perform: gpiv_rr < image.png | gpiv_errvec > testfile.piv

       invoking:  'gpiv_process-chain -proc_imgrec -proc_valid -proc_scale testfile.png' will do: gpiv_recimg | gpiv_rr | gpiv_errvec | gpiv_scale
       > testfile.piv

SEE ALSO

       gpivtools

AUTHOR

       Gerber Van der Graaf

								  19 Januari 2005					     GPIV_PROCESS-CHAIN(1)