Histograms on Linux


Thread Tools Search this Thread
Top Forums UNIX for Dummies Questions & Answers Histograms on Linux
# 1  
Old 06-19-2012
Histograms on Linux

Hi,

I have a file of the following style

Code:
chr1 122333 1223344 1.87887877778
chr1 2324343 433433 1.98794334343
chr2 343545 54545454 9.0009123232
chr3 843749 89449379 10.004343722
................................................
................................................

I would like to plot a histogram with normal curve for the above input file's 4th column.

I have been working with R. I could get the histogram but the normal curve is being truncated. There are more than 2090000 records in the input file and the range of values in the 4th column is from 1.7566666 till 162430.090000.

Any helps appreciated. This is the R code I have been using..

Code:
setwd("/path/")
data<-read.table("input.txt",sep="\t",header=F)
x<-data$V4
h<-hist(x, axes=FALSE, xaxt='n', yaxt='n',col="green",main="GATA3-TPMDistribution",xlab="TPMValues",probability=TRUE)
axis (side=1, at=seq(0,162450, 1000))
axis (side=2, at=seq(0,0.008,0.0001))
s=sd(x)
m=mean(x)
curve(dnorm(x,mean=m,sd=s),add=TRUE,lwd=3,col="red")
lines(density(x),col="blue")
abline(v=mean(x),col="blue")
mtext(paste("mean",round(mean(x),1),";sd",round(sd(x),1),";N",length(x),sep=""),side=1,cex=.75)
dev.off()

Any thoughts on how to achieve the samething on Linux.

Last edited by jacobs.smith; 06-19-2012 at 03:00 PM..
# 2  
Old 06-19-2012
In what way is it being truncated? What are the results you expect, and what are the results you get?

How large is your input data in bytes, not records?
# 3  
Old 06-19-2012
Hi Corona,

I could only see the end of the normal curve. But, I would like to see the whole normal curve, I mean its start, peak and stop.

I would like to look at the distribution of the values in the 4th column using an histogram. The results I see are fine enough, but without properly looking into the curve, I can't infer anything.

My input file is around 30MB.

Please let me know if you would like to know anything in detail.

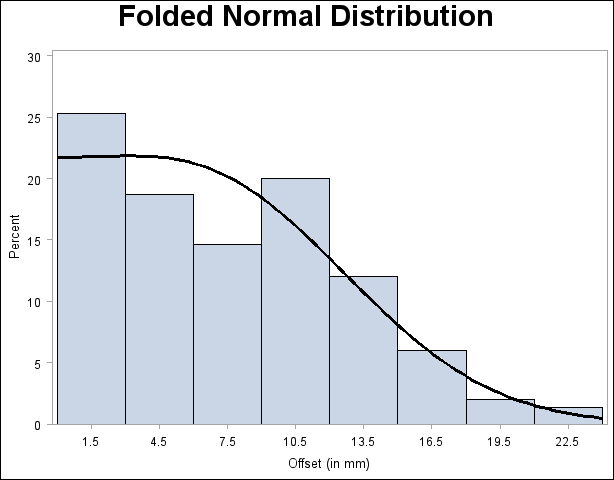
I would like to have my histogram with a curve like this -

Image


But, I am getting it this way -


Image

Last edited by jacobs.smith; 06-19-2012 at 01:03 PM..
 
Login or Register to Ask a Question

Previous Thread | Next Thread

2 More Discussions You Might Find Interesting

1. UNIX for Beginners Questions & Answers

Simple sed command not working; could be a Mac/Linux vs. PC/Linux issue

Hello, I am on a Mac and trying to clean up some monthly files with a very simple SED: sed '3,10d;/<ACROSS>/,$d' input.txt > output.txt (from the input, delete lines 3 - 10; then delete from the line containing <ACROSS> to the end of the file) then output to output.txt Even when I try... (2 Replies)
Discussion started by: verbatim
2 Replies

2. Fedora

Which is the better platform to learn UNIX/Linux (Kali Linux Vs. Red Hat or other)?

I just started a new semester and I started my UNIX class yesterday. I've already decided to use python along with my learning process but what I really want to use with it is Kali as my UNIX/Linux platform to learn off of since I already wanted to learn Cyber Sec. anyways. I just wanted to know if... (12 Replies)
Discussion started by: ApacheOmega
12 Replies
Login or Register to Ask a Question