|
|
Sponsored Content
Top Forums
UNIX for Beginners Questions & Answers
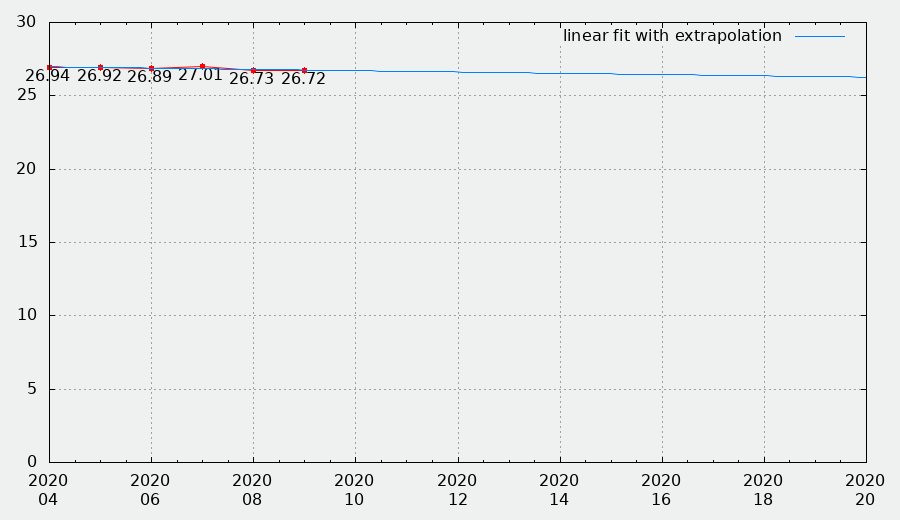
Gnuplot 4.6 : problem with my X axis
Post 303045997 by Tim2424 on Tuesday 21st of April 2020 09:27:38 AM
 04-21-2020
|
|
9 More Discussions You Might Find Interesting
1. UNIX for Dummies Questions & Answers
Hi, I am a beginner using UNIX, and was wondering how to use gnuplot from UNIX on my pc. I am connected remotely to my work's UNIX server using Secure Shell Client, and gnuplot won't open a new window when I use the plot command. How do I do this?
Moreover, is it possible to save things from the... (0 Replies)
Discussion started by: KTTFB64
0 Replies
2. AIX
Hi guys,
I have a AIX 4.3 system, and I need to configure a printer, but that printer it's connected to a axis print server. I have lot of years working with unix, but never added a printer in a AIX system. I need to add using "remote print queue", and add the hostname and ip to the /etc/hosts?... (2 Replies)
Discussion started by: uadm26
2 Replies
3. OS X (Apple)
I'm using my wife's Macbook, and I just noticed that her screen is off axis, but I can't find a way to adjust it. I've tried playing around with resolution in preferences, but nothing.
Maybe a terminal command for adjusting the x and y values of the screen?
Any and all suggestions welcomed :) (2 Replies)
Discussion started by: andou
2 Replies
4. UNIX and Linux Applications
Hi,
I am trying to make a plot of an ASCII file using GNUplot, but I keep getting error msg:
for example plot filename.txt
It says that (.txt ) is not identified ... I tried to write it without the .txt part, but I also get the error msg.
Any idea why? :confused: (1 Reply)
Discussion started by: cosmologist
1 Replies
5. Shell Programming and Scripting
Hi All,
Seems I have an xargs stdin problem that I don't understand.
I have a script (call it myscript.sh) that takes the names of one or more file(s) specified on the command line and creates a single gnuplot command file containing multiple records, one for each specified file. Each of... (9 Replies)
Discussion started by: paulianna2002
9 Replies
6. UNIX for Dummies Questions & Answers
Hi,
Im trying to plot a time series with gnuplot. this is my script
set xdata time
set yrange
set timefmt "%H"
set xrange
set format x "%H:%M:%S"
plot "time_vs_times.txt" using 1:2 title 'Interarrival time' with points lw 2
and this is my data
11:14:18 5
11:14:19 10... (10 Replies)
Discussion started by: jamie_123
10 Replies
7. Shell Programming and Scripting
Hello list,
I have a source CSV data file as follows:
PC_NAME,MS11-040,MS11-039,MS11-038,MS11-035
abc123,Not Applicable,Not Applicable,Not Applicable,Not Applicable
abc987,Not Applicable,Not Applicable,Not Applicable,Not Applicable
tnt999,Not Applicable,Not Applicable,Applicable,Not... (2 Replies)
Discussion started by: landossa
2 Replies
8. Shell Programming and Scripting
Let me start by saying I'm new to gnuplot and not very good at unix at all..
Anyway, I'm each minute measuring temperature and humidity and saves the last 60 readings along with time in a textfile, values_minute.
The contents of the file is formatted like this: time temperature humidity
... (8 Replies)
Discussion started by: hakro807
8 Replies
9. Shell Programming and Scripting
Hello
I have a text file with tens of thousands of rows
The format is
x y
where both x and y can be anything between -100 and +100.
What I would like to do is have a 3d gnuplot where there are 10,000 squared or bins and each bin will count how many rows have a value that would be... (1 Reply)
Discussion started by: garethsays
1 Replies
LEARN ABOUT DEBIAN
pyxplot
PYXPLOT(1)						      General Commands Manual							PYXPLOT(1)

NAME

       pyxplot - a commandline data processing, graph plotting, and vector graphics suite.

SYNOPSIS

       pyxplot [file ...]

DESCRIPTION

       PyXPlot	is  a multi-purpose command-line tool for performing simple data processing and for producing graphs and vector graphics. The cen-
       tral philosophy of PyXPlot's interface is that common tasks -- for example, plotting labelled graphs of data -- should  be  accessible  via
       short,  simple  and  intuitive commands which require minimal typing to produce a first draft result. At the same time, these commands also
       take a sufficient range of optional arguments and settings to allow these figures to be subsequently fine-tuned into a wide range  of  dif-
       ferent styles, appropriate for inclusion in reports, talks or academic journals.

       As  well as being a graph-plotting package, PyXPlot also has facilities for fitting mathematical functions to data, for numerically solving
       simple systems of equations, and for converting datafiles between different formats. Its mathematical environment can interpolate datasets,
       integrate  and  differentiate  them,  and  take Fourier transforms. PyXPlot's ability to keep track of the physical units in which data are
       expressed, and to convert data between different units of measurement, mean that it can be used as a powerful desktop calculator.

       PyXPlot's interface bears some striking similarities to that of Gnuplot.  Specifically, the commands used for plotting simple graphs in the
       two  programs  are virtually identical, though the syntax used for more advanced plotting often differs and PyXPlot's mathematical environ-
       ment is hugely extended over that of Gnuplot. This means that Gnuplot users will have a head start with	PyXPlot:  simple  Gnuplot  scripts
       will often run in PyXPlot with minimal modification.

       A number of examples of the graphical output which PyXPlot can produce may be found on the PyXPlot website: <http://www.pyxplot.org.uk/>.

       Full documentation can be found in: /usr/share/doc/pyxplot/pyxplot.pdf

COMMAND LINE OPTIONS

	 -h, --help:	   Display this help.
	 -v, --version:    Display version number.
	 -q, --quiet:	   Turn off initial welcome message.
	 -V, --verbose:    Turn on initial welcome message.
	 -c, --colour:	   Use coloured highlighting of output.
	 -m, --monochrome: Turn off coloured highlighting.

AUTHORS

       Dominic Ford, Ross Church and Zoltan Voros <coders@pyxplot.org.uk>

CREDITS

       Thanks to Dave Ansell, Rachel Holdforth, Stuart Prescott, Michael Rutter and Matthew Smith, all of whom have made substantial contributions
       to the development of PyXPlot.

SEE ALSO

       pyxplot_watch(1),gnuplot(1)

																	PYXPLOT(1)