|
|
Sponsored Content
Top Forums
UNIX for Advanced & Expert Users
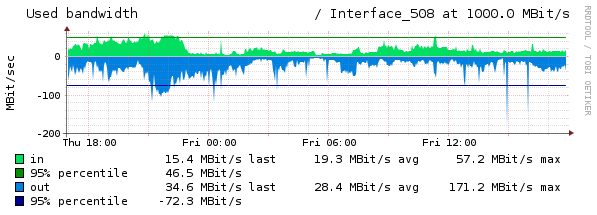
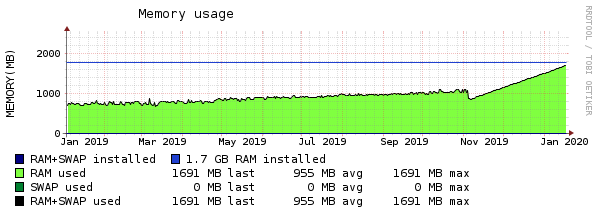
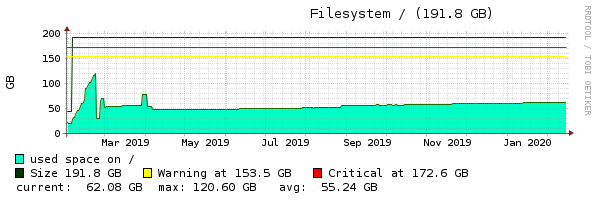
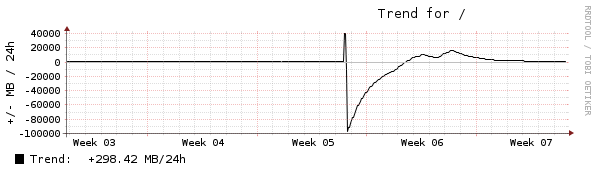
Nearly Random, Uncorrelated Server Load Average Spikes
Post 303044127 by stomp on Friday 14th of February 2020 12:23:07 PM

|
|
10 More Discussions You Might Find Interesting
1. UNIX for Advanced & Expert Users
we have an unix system which has
load average normally about 20.
but while i am running a particular unix batch which performs heavy
operations on filesystem and database average load
reduces to 15.
how can we explain this situation?
while running that batch idle cpu time is about %60-65... (0 Replies)
Discussion started by: gfhgfnhhn
0 Replies
2. UNIX for Dummies Questions & Answers
Hello all, I have a question about load averages.
I've read the man pages for the uptime and w command for two or three different flavors of Unix (Red Hat, Tru64, Solaris). All of them agree that in the output of the 2 aforementioned commands, you are given the load average for the box, but... (3 Replies)
Discussion started by: Heathe_Kyle
3 Replies
3. UNIX for Dummies Questions & Answers
Hello, Here is the output of top command. My understanding here is,
the load average 0.03 in last 1 min, 0.02 is in last 5 min, 0.00 is in last 15 min.
By seeing this load average, When can we say that, the system load averge is too high?
When can we say that, load average is medium/low??... (8 Replies)
Discussion started by: govindts
8 Replies
4. Solaris
Hi,
i have installed solaris 10 on t-5120 sparc enterprise.
I am little surprised to see load average of 2 or around on this OS.
when checked with ps command following process is using highest CPU. looks like it is running for long time and does not want to stop, but I do not know... (5 Replies)
Discussion started by: upengan78
5 Replies
5. UNIX for Dummies Questions & Answers
Hello AlL,..
I want from experts to help me as my load average is increased and i dont know where is the problem !!
this is my top result :
root@a4s # top
top - 11:30:38 up 40 min, 1 user, load average: 3.06, 2.49, 4.66
Mem: 8168788k total, 2889596k used, 5279192k free, 47792k... (3 Replies)
Discussion started by: black-code
3 Replies
6. UNIX for Advanced & Expert Users
Hi ,
I am using 48 CPU sunOS server at my work.
The application has facility to check the current load average before starting a new process to control the load.
Right now it is configured as 48. So it does mean that each CPU can take maximum one proces and no processe is waiting.
... (2 Replies)
Discussion started by: kumaran_5555
2 Replies
7. Solaris
NPROC USERNAME SWAP RSS MEMORY TIME CPU
320 oracle 23G 22G 69% 582:55:11 85%
47 root 148M 101M 0.3% 99:29:40 0.3%
53 rafmsdb 38M 60M 0.2% 0:46:17 0.1%
1 smmsp 1296K 5440K 0.0% 0:00:08 0.0%
7 daemon ... (2 Replies)
Discussion started by: snjksh
2 Replies
8. UNIX for Dummies Questions & Answers
Hi,
I am getting a high load average, around 7, once an hour. It last for about 4 minutes and makes things fairly unusable for this time.
How do I find out what is using this. Looking at top the only thing running at the time is md5sum.
I have looked at the crontab and there is nothing... (10 Replies)
Discussion started by: sm9ai
10 Replies
9. UNIX for Dummies Questions & Answers
how load average is calculated and what exactly is it
difference between cpu% and load average (9 Replies)
Discussion started by: robo
9 Replies
10. Programming
Here we go....
Preface:
..... so in a galaxy far, far, far away from commercial, data sharing corporations.....
For this project, I used the ESP-WROOM-32 as an MQTT (publish / subscribe) client which receives Linux server "load averages" as messages published as MQTT pub/sub messages.... (6 Replies)
Discussion started by: Neo
6 Replies
LEARN ABOUT DEBIAN
gkrellkam-list
GKRELLKAM-LIST(5)						File Formats Manual						 GKRELLKAM-LIST(5)

NAME

       gkrellkam-list - format of the list description files used by GKrellKam

DESCRIPTION

       GKrellKam  lists  describe  a  series  of  image sources, used in order or at random by the GKrellKam plugin. Online lists (downloadable by
       GKrellKam with HTTP) use this same syntax.

       Blank lines and comments (beginning with '#') in GKrellKam lists are ignored. Every line of text that does not begin with a  tab  character
       is considered an image source.

       An image source can be one of several types:

       image  Sources of type image consist of a complete local filename to an image file.

       url    Type url is just that; a ftp:// or http:// URL pointing at an online image file.

       script Type  script  is	a  system command, executed in a shell by GKrellKam when it's time to get this image. The output of the command is
	      assumed to be a complete filename of a local image file, optionally terminated with newlines/whitespace. The corresponding image	is
	      loaded.

       list   Type list causes a different GKrellKam list to be included in the current one.

       Each image source line should look like this:

	      type: name

       The  "type:  "  part of the line can be omitted for images and URLs, to make these list files backwards compatible with earlier versions of
       GKrellKam, but it is suggested that you specify them. It will enhance the readability of the list file.

       There are also properties that can be applied to types image, url, and script. Properties must follow the image source line that they  mod-
       ify, and must begin with a tab character. These include:

       tooltip
	      This  sets  the  message	shown  when the mouse is kept over the image panel in GKrellKam for a few seconds. If not set, the image's
	      filename or URL is shown instead.

       seconds
	      This changes the number of seconds that an image will remain displayed.  If not set, the "Default number of seconds"  set  for  that
	      panel in the GKrellM configuration window will be used.

       refresh
	      If  set,	this  sets  the  minimum length of time that must elapse before the image is re-loaded. If the image cycles up before that
	      time, the old image will be used. For script types, this means that the script will not be re-run. For url types, the image will not
	      be  fetched using wget. When this property is not set, url images will be downloaded every time they are displayed, and scripts will
	      be run every time.

EXAMPLE

       This is a simple example of a GKrellKam list. For a better example, see example.list from this distribution.

	      # .krellkam.list
	      # This list rotates through ~/pics/mypic[1-4].jpg along with a
	      # webcam, and then displays the pictures in ~/lists/sub.list

	      image: /home/paul/pics/mypic1.jpg
	      /home/paul/pics/mypic2.jpg
	      image: /home/paul/pics/mypic3.jpg
	      http://www.usu.edu/webcam/fullsize.jpg
	      [tab] tooltip: This is the building where I work

	      image: /home/paul/pics/mypic4.jpg
	      [tab] seconds: 4
	      [tab] tooltip: Don't display this one very long

	      list: /home/paul/lists/sub.list

FILES

       $HOME/.krellkam.list - The default source for the first GKrellKam panel
       example.list - A sample GKrellKam list

AUTHOR

       GKrellKam was written by paul cannon <paul@cannon.cs.usu.edu>.  This manual page was written by the same author for inclusion in the GKrel-
       lKam distribution, and may be used by others.

SEE ALSO

       wget(8)

								    Dec 7, 2001 						 GKRELLKAM-LIST(5)