|
|
Sponsored Content
Operating Systems
Solaris
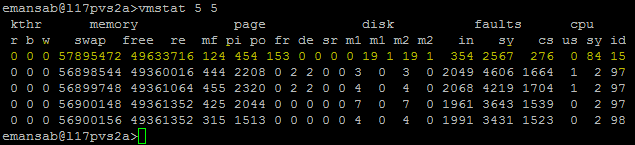
Reason for abnormal value in vmstat output
Post 303013773 by anaigini45 on Wednesday 28th of February 2018 05:46:44 AM
 02-28-2018
|
|
10 More Discussions You Might Find Interesting
1. UNIX for Advanced & Expert Users
i have 2 question about vmstat
1)
pin (pagein) output of vmstat is always zero for our system
what is the meaning of this?
(pout significantly changes depending on the running processes)
2)
sometimes react output
of vmstat is given in K like 44K
sometimes it is given without any unit... (1 Reply)
Discussion started by: gfhgfnhhn
1 Replies
2. UNIX for Dummies Questions & Answers
Hello all
This is a sample vmstat output ...
$ vmstat 2 2
kthr memory page disk faults cpu
r b w swap free re mf pi po fr de sr hx hx hx hx in sy cs us sy id
1 0 0 23105784 7810488 323 767 1742 5 5 0 0 0 0 0 0 683 780 457 43 ... (9 Replies)
Discussion started by: luft
9 Replies
3. Shell Programming and Scripting
I need to capture the vmstat output of a server every 5 minutes, in a text filename with the name in the format vmoutput. yesterday's date.txt. I need to get the vmstat o/p for the whole day with 5 minutes interval and send it (preferably ftp) to my local desktop folder.
eg: vmstat 300... (1 Reply)
Discussion started by: yuvanash
1 Replies
4. HP-UX
i am using HP-UX and i have this process called HPUX childwrapper taking about 99% cpu.i want to know what the process does? and if i should kill it (4 Replies)
Discussion started by: tomjones
4 Replies
5. UNIX for Advanced & Expert Users
Hello,
I'm seeing this problem with vmstat, where the first line of output always has the same CPU statistics. For example:
neked@nekedmachine:~$ date && vmstat
Fri Jul 24 06:57:08 EDT 2009
procs -----------memory---------- ---swap-- -----io---- --system-- -----cpu------
r b swpd ... (0 Replies)
Discussion started by: neked
0 Replies
6. AIX
Hello everybody, When i run Nmon the output is really incomprehensible
vmstat 5
System configuration: lcpu=16 mem=24576MB ent=4.00
kthr memory page faults cpu
----- ----------- ------------------------ ------------ -----------------------... (3 Replies)
Discussion started by: Vit0_Corleone
3 Replies
7. Solaris
Hi all.
I need some assistance with my vmstat output.
We have several oracle db's running on our solaris machine:
SunOS rcworaprd 5.9 Generic_112233-07 sun4u sparc SUNW,Sun-Fire-480R
Recently I bumped up our main Oracle database to use 6 GB instead of 4 GB as vmstat output was showing... (1 Reply)
Discussion started by: jamie_collins
1 Replies
8. AIX
Hi AIX Expert,
the fr (page freed/page replacement) and sr (pages scanned by page-replacement algorithm) values from the vmstat output (see below please) are very high. I usually see this high value during the oracle database backup. In addition, the page scan/page steal/ page faults values... (7 Replies)
Discussion started by: Beginer0705
7 Replies
9. Solaris
Hi,
I am porting a piece of code from Solaris to Linux. Code uses VMSTAT command.
On Solaris machine VMSTAT output is following:
uname -a:
SunOS rgsm01 5.9 Generic_118558-03 sun4u sparc SUNW,Sun-Fire-V440
vmstat:
kthr memory page disk faults cpu
r b w swap free re mf pi po fr de sr m1 m2... (3 Replies)
Discussion started by: Basant Mishra
3 Replies
10. UNIX for Dummies Questions & Answers
Hi,
Users are reporting performance issue on my Sun Solaris 10 server. I am on the server. I don't see a issue or I might be looking at the wrong thing. Please help.
I don't see anything on sar. it's all zero on that. Not sure why users are reporting high CPU and unresponsive at times. ... (1 Reply)
Discussion started by: samnyc
1 Replies
LEARN ABOUT ULTRIX
iostat
iostat(1)						      General Commands Manual							 iostat(1)

Name
       iostat - report I/O statistics

Syntax
       iostat [ -c ] [ -t ] [ disknames ] [ interval ] [ count ]

Description
       The  command  reports  I/O  statistics for terminals, disks and cpus.  For terminals the number of input and output characters are counted.
       For disks the number of 512 byte blocks per second and number of transfers per second are displayed.  For cpus, it provides the	percentage
       of  time  the system has spent in user mode, in user mode running low priority (niced) processes, in system mode, and idling.  On multipro-
       cessor systems these cpu statistics represent a cumulative summary of all the cpus.

       The optional disknames argument causes disk statistics to be displayed for the specified disks.	If this argument  is  not  specified  then
       disk statistics will be displayed for the first 3 disks only.

       The  optional interval argument causes to report once each interval seconds.  The first report is for all time since a reboot and each sub-
       sequent report is for the last interval only.

       The optional count argument restricts the number of reports.

Options
       -c   Displays the percentage of time each cpu spent in user mode, running low priority (nice'd) processes, in system mode, and idling.

       -t   Displays the number of characters read from and written to terminals.

Examples
       This example will cause cpu and disk statistics for the 5 disks ra0, ra1, ra2, ra3, and ra4.
	    iostat ra0 ra1 ra2 ra3 ra4
       This example will cause cpu, terminal, and disk statistics for ra0 to be displayed and updated every 2 seconds.
	    iostat -t ra0 2

Files
See Also
       vmstat(1), cpustat(1)

																	 iostat(1)