|
|
Sponsored Content
Top Forums
Web Development
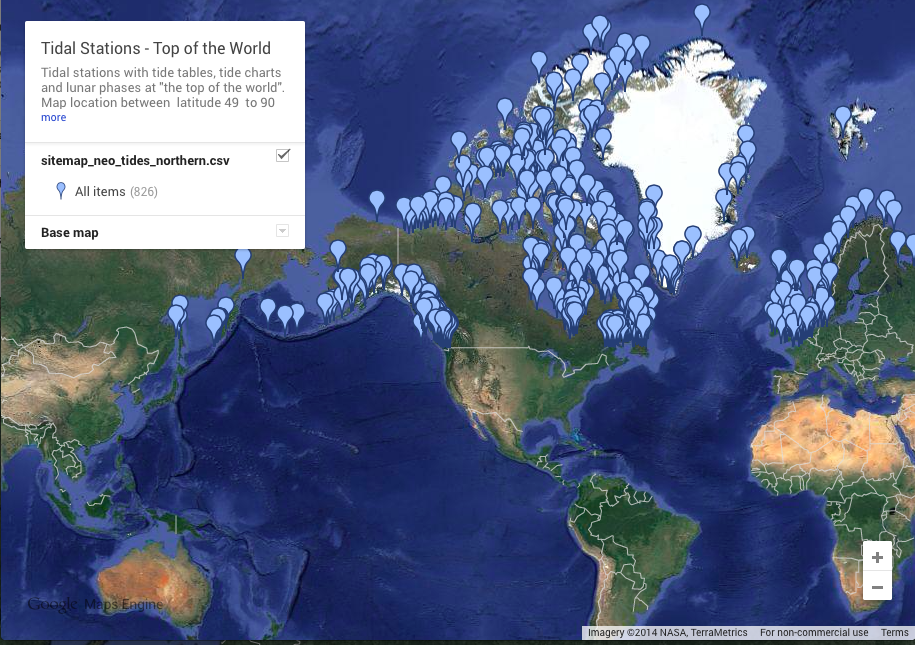
Tidal Stations - Top of the World
Post 302890154 by Neo on Tuesday 25th of February 2014 11:46:13 AM

|
|
9 More Discussions You Might Find Interesting
1. UNIX for Advanced & Expert Users
hi
i am needed to use tidal's scheduler to schedule unix scripts available on server A. while creating a job to be scheduled, it has an option called command which will take a path of the file. i have seen several examples in the following way
e:\tidal\bin\sleep.exe
here i did not understand two... (0 Replies)
Discussion started by: balireddy_77
0 Replies
2. Shell Programming and Scripting
I would like to change root password for 30 stations by script.
The script will rlogin to each station and change the root password. (2 Replies)
Discussion started by: whatiwan2000
2 Replies
3. Web Development
Just created this beta web app for Tidal Stations - Far East and Australasia:
https://www.unix.com/members/1-albums112-picture628.png
I plan to do the entire "world" soon. (0 Replies)
Discussion started by: Neo
0 Replies
4. Web Development
Tidal Stations - North America (East)
https://www.unix.com/members/1-albums112-picture629.png (0 Replies)
Discussion started by: Neo
0 Replies
5. Web Development
Tidal Stations - North America (West Coast)
https://www.unix.com/members/1-albums112-picture631.png (0 Replies)
Discussion started by: Neo
0 Replies
6. Web Development
Tidal Stations - Europe and Africa
https://www.unix.com/members/1-albums112-picture632.png (0 Replies)
Discussion started by: Neo
0 Replies
7. Web Development
Tidal Stations - South America
https://www.unix.com/members/1-albums112-picture633.png (0 Replies)
Discussion started by: Neo
0 Replies
8. Web Development
Tidal Stations - The Ocean Tropics
For warm water lovers everywhere:
https://www.unix.com/members/1-albums112-picture634.png (0 Replies)
Discussion started by: Neo
0 Replies
9. What is on Your Mind?
This is an excellent video comment on modern society and the remix is good too:
https://www.youtube.com/watch?v=5DU1B_XkyIk
5DU1B_XkyIk
Watch the video above and post your comments. (3 Replies)
Discussion started by: Neo
3 Replies
LEARN ABOUT DEBIAN
jifty::plugin::chart::renderer::simplebars
Jifty::Plugin::Chart::Renderer::SimpleBars(3pm) 	User Contributed Perl Documentation	   Jifty::Plugin::Chart::Renderer::SimpleBars(3pm)

NAME

       Jifty::Plugin::Chart::Renderer::SimpleBars - a simple horizontal bar chart

DESCRIPTION

       This is a simple renderer for charts created both as a dead simple way of rendering horizontal bar charts, which can be a very simple way
       of rendering data, and as a prototype for some other work I'm thinking of doing with the chart plugin.

OPTIONS

       Of the rendering API, this only uses the first dataset given and ignores any others. It also fails if used for any type other than the only
       one it supports "horizontalbars".

       It takes the following options:

       summary
	   To maximize the accessibility of your chart, set this to describe the data. This will set the table's summary attribute.

STYLING

       Please be aware that when using this object, you can change the bar color using CSS like so:

	 div.simple_bars span.bar {
	     background-color: black;
	 }

METHODS

   init
       Tell Jifty about the CSS and JS files SimpleBars needs.

   render
       Renders a horizontal bar chart. This is done by rendering a table of HTML values, which is then converted to a bar chart by the Javascript
       added to the response during "init".

       If JavaScript is not supported by the browser, all the data is presented ina table. They can still read the data, but just not in the most
       readable form.

AUTHOR

       Andrew Sterling Hanenkamp, "<andrew.hanenkamp@boomer.com>"

COPYRIGHT AND LICENSE

       Copyright 2007 Boomer Consulting, Inc.

       This is free software. You may modify and redistribute it under the same terms as Perl itself.

perl v5.12.4							    2009-03-09			   Jifty::Plugin::Chart::Renderer::SimpleBars(3pm)