|
|
Sponsored Content
Top Forums
UNIX for Dummies Questions & Answers
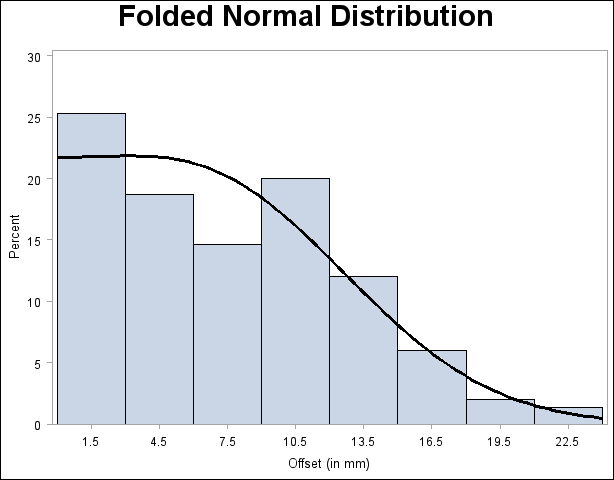
Histograms on Linux
Post 302658539 by jacobs.smith on Tuesday 19th of June 2012 11:54:04 AM
|
|
2 More Discussions You Might Find Interesting
1. Fedora
I just started a new semester and I started my UNIX class yesterday. I've already decided to use python along with my learning process but what I really want to use with it is Kali as my UNIX/Linux platform to learn off of since I already wanted to learn Cyber Sec. anyways. I just wanted to know if... (12 Replies)
Discussion started by: ApacheOmega
12 Replies
2. UNIX for Beginners Questions & Answers
Hello,
I am on a Mac and trying to clean up some monthly files with a very simple SED:
sed '3,10d;/<ACROSS>/,$d' input.txt > output.txt
(from the input, delete lines 3 - 10; then delete from the line containing <ACROSS> to the end of the file)
then output to output.txt
Even when I try... (2 Replies)
Discussion started by: verbatim
2 Replies
LEARN ABOUT DEBIAN
paps
PAPS(1) 						      General Commands Manual							   PAPS(1)

NAME

       paps - UTF-8 to PostScript converter using Pango

SYNOPSIS

       paps [options] files...

DESCRIPTION

       paps reads a UTF-8 encoded file and generates a PostScript language rendering of the file. The rendering is done by creating outline curves
       through the pango ft2 backend.

OPTIONS

       These programs follow the usual GNU command line syntax, with long options starting with  two  dashes  (`-').   A  summary  of  options	is
       included below.

       --landscape
	      Landscape output. Default is portrait.

       --columns=cl
	      Number of columns output. Default is 1.
	      Please notice this option isn't related to the terminal length as in a "80 culums terminal".

       --font=desc
	      Set the font description. Default is Monospace 12.

       --rtl  Do right to left (RTL) layout.

       --paper ps
	      Choose paper size. Known paper sizes are legal, letter and A4. Default is A4.

       Postscript points
	      Each postscript point equals to 1/72 of an inch. 36 points are 1/2 of an inch.

       --bottom-margin=bm
	      Set bottom margin. Default is 36 postscript points.

       --top-margin=tm
	      Set top margin. Default is 36 postscript points.

       --left-margin=lm
	      Set left margin. Default is 36 postscript points.

       --right-margin=rm
	      Set right margin. Default is 36 postscript points.

       --gutter-width=gw
	      Set gutter width. Default is 40 postscript points.

       --help Show summary of options.

       --header
	      Draw page header for each page.

       --markup
	      Interpret the text as pango markup.

       --lpi  Set the lines per inch. This determines the line spacing.

       --cpi  Set the characters per inch. This is an alternative method of specifying the font size.

       --stretch-chars
	      Indicates  that  characters  should be stretched in the y-direction to fill up their vertical space. This is similar to the texttops
	      behaviour.

AUTHOR

       paps was written by Dov Grobgeld <dov.grobgeld@gmail.com>.

       This manual page was written by Lior Kaplan <kaplan@debian.org>, for the Debian project (but may be used by others).

								  April  17, 2006							   PAPS(1)

